
Nature Machine Intelligence-2022 Learning functional properties of proteins with language models
Paper: Learning functional properties of proteins with language models
Survey: A review of protein representation models
Abstract
This work presents a detailed study of protein representation learning. It first classifies and explains each method, then benchmarks their predictive performance on: (1) semantic similarity between proteins, (2) ontology-based protein function, (3) drug target protein families, and (4) changes in protein–protein binding affinity after mutation. The strengths and weaknesses of each approach are evaluated and discussed.
Introduction
As of May 2021, the UniProt knowledge base of protein sequences and annotations contained roughly 215 million protein entries; however, only about 560,000 (~0.26%) had been manually reviewed and annotated by expert curators. This indicates a large gap between current sequencing (data production) and annotation (labeling) capacity, largely because wet-lab experiments are costly and time-consuming.
Protein function prediction (PFP) can be defined as automatically or semi-automatically assigning functional definitions to proteins. The main terms for biomolecular function are curated in the Gene Ontology (GO) system. The most comprehensive benchmarking project for PFP is Critical Assessment of Functional Annotation (CAFA), in which participants predict GO-based functional associations for a set of target proteins; those functions are later verified by manual curation to evaluate predictor performance.
For complex computational problems, protein representations are high-dimensional and nonlinear, which makes them well suited to deep learning.
Protein representation methods fall into two categories:
- Classical representations (model-driven approaches): generated using predefined property rules, such as evolutionary relationships between genes/proteins or physicochemical properties of amino acids (Supplementary Table 1).
- Data-driven approaches: trained with statistical and machine learning methods via pretraining tasks; the model outputs can then be used for other protein tasks such as function prediction. In this sense, representation learning models leverage knowledge transfer from one task to another.
Protein models today are heavily influenced by NLP and are often called protein language models.
In this study, the authors survey existing protein representation learning methods proposed since 2015 and measure their potential to capture functional properties of proteins through detailed benchmark analyses, covering both classical and AI-based methods.
To assess how well each representation model captures different aspects of functional information, they construct and apply benchmarks based on: (1) semantic similarity inference between proteins, (2) ontology-based PFP, (3) drug target protein family classification, and (4) protein–protein binding affinity estimation.
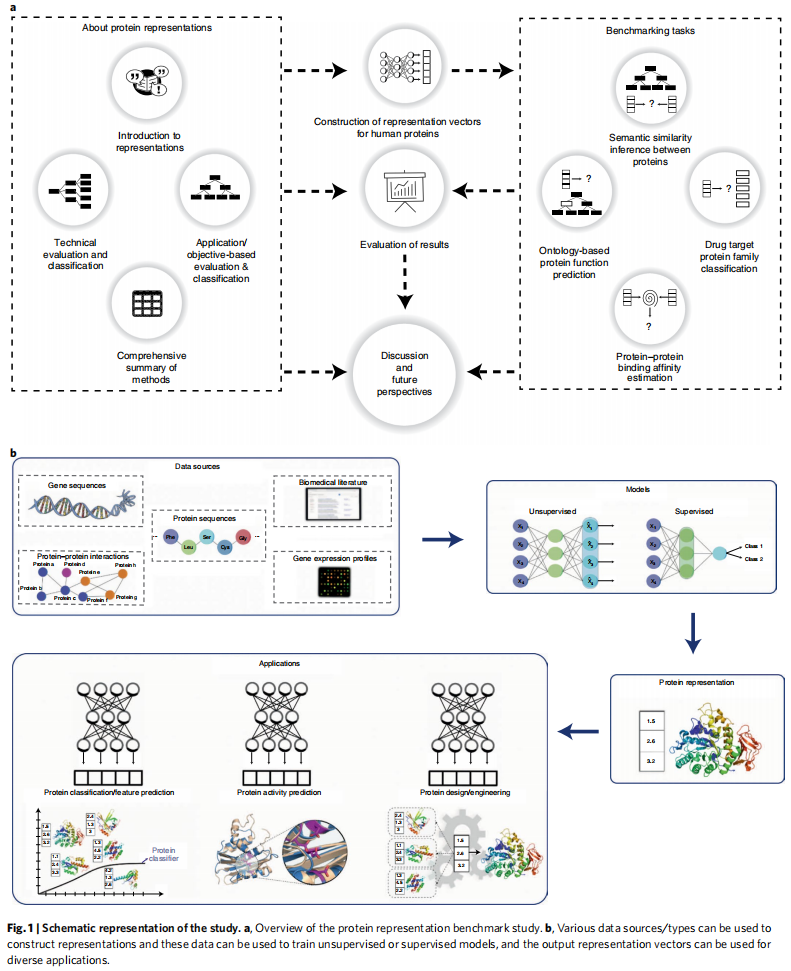
The overall study is summarized in Fig. 1a.
The authors provide benchmark software (PROBE).
Results
Construction and application of protein representations are shown in Fig. 1b.
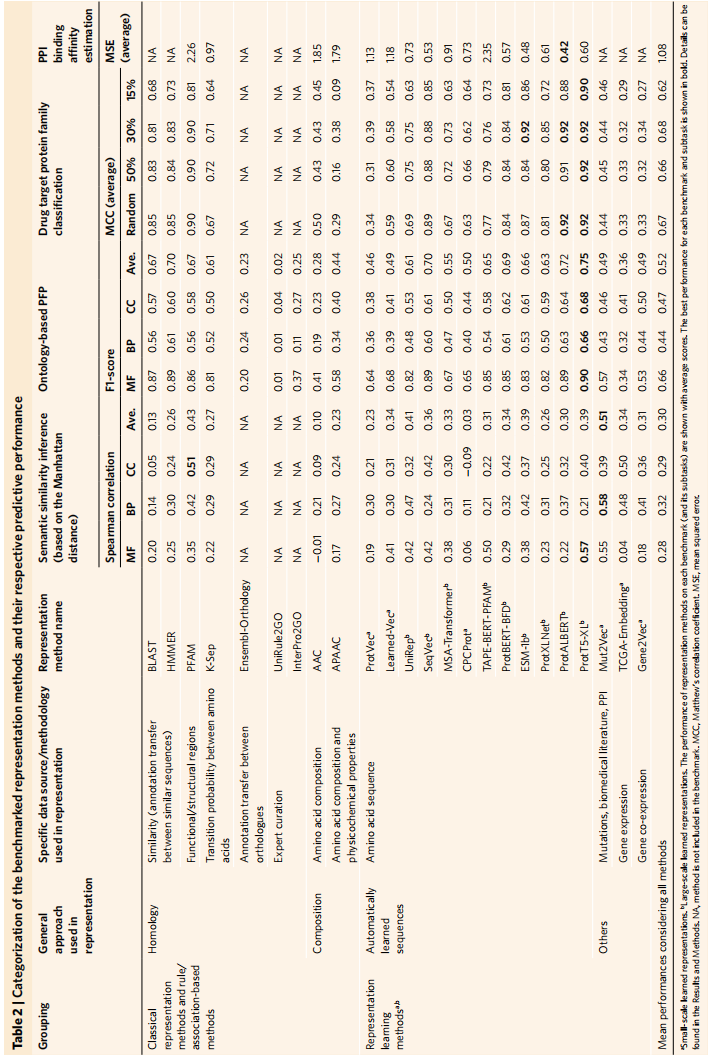
Average performance of all methods on the four benchmarks is in Table 2.
Depending on the resolution of the predicted property, protein representation learning methods can be grouped into protein-level or residue-level features; this work focuses mainly on the former.
Semantic similarity inference
This analysis measures how much information representation models capture about biomolecular functional similarity.
Pairwise quantitative similarities between protein representation vectors in the dataset were first computed using cosine, Manhattan, and Euclidean distance/similarity, then compared with ground-truth similarities for those proteins—i.e., the relationship between representation-vector similarity and actual GO-based semantic similarity for the same protein pairs.
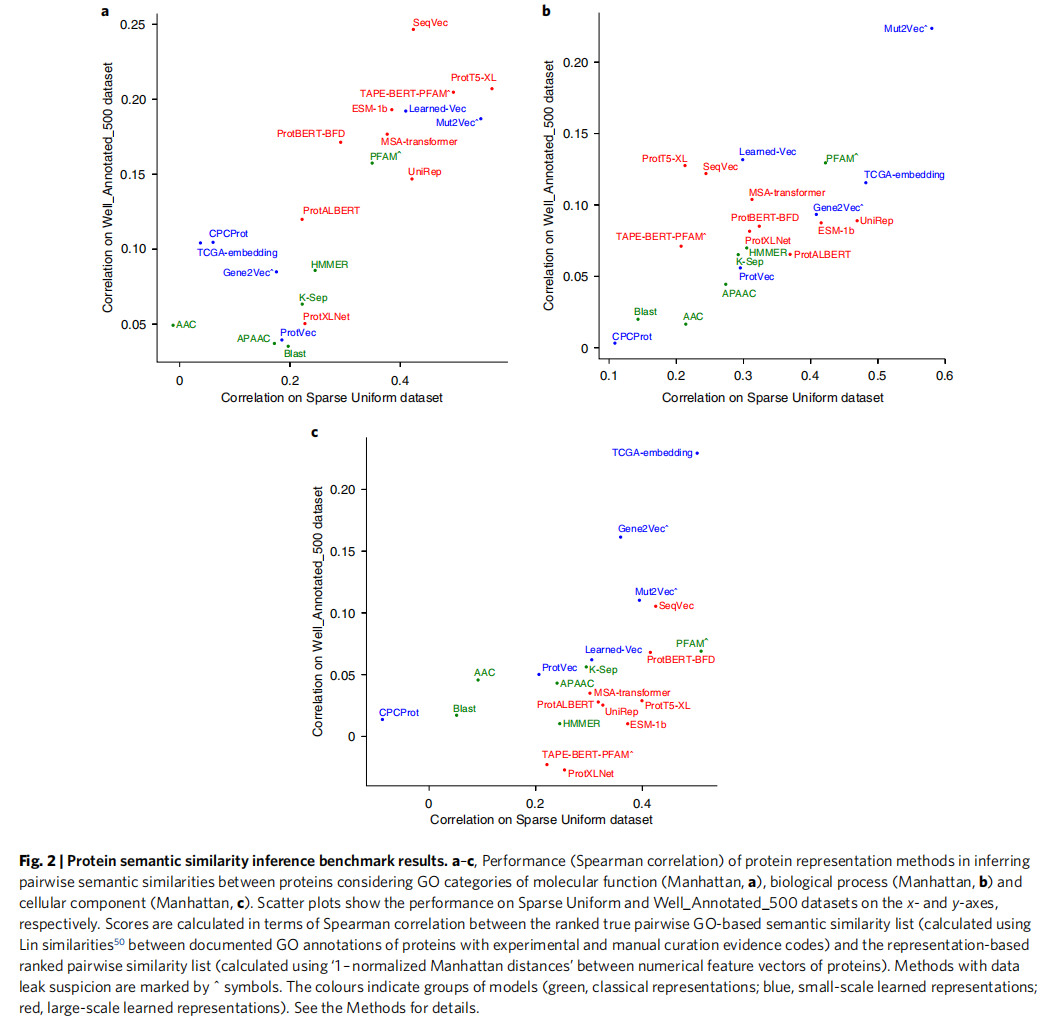
From Fig. 2a, ProtT5-XL is the most successful representation for GO molecular function (MF); Mut2Vec is best for GO biological process (BP); TCGA_EMBEDDING and PFAM are best for GO cellular component (CC).
When building the benchmark, the authors first used the entire reference human proteome as the test dataset; however, all pairwise combinations among ~20,000 proteins proved to be a sparse comparison space, making differences between methods statistically insignificant. Beyond the data, an important hyperparameter is the similarity metric; the authors tried cosine, Manhattan, Euclidean, and others, and results should be interpreted across metrics to avoid misleading conclusions.
Ontology-based PFP
This benchmark evaluates how successfully representation models perform in classification-based automatic PFP.
A linear classification head was used (linear support vector classification from scikit-learn with stochastic gradient descent (SGD) optimization).
Heatmaps based on F1 score in Fig. 3 show PFP performance for nine GO groups ([low, middle, high] × [shallow, normal, specific]).
Performance appears better than in CAFA challenges because evaluation used a single test split rather than the full CAFA test set—a deliberate design choice to prevent all benchmarked methods from accumulating scores in low-performance regions (especially for difficult ontologies such as BP), which would obscure clear comparison. The goal is to compare methods from different angles in a highly controlled setting, not to identify the best overall PFP method, which is the aim of CAFA.
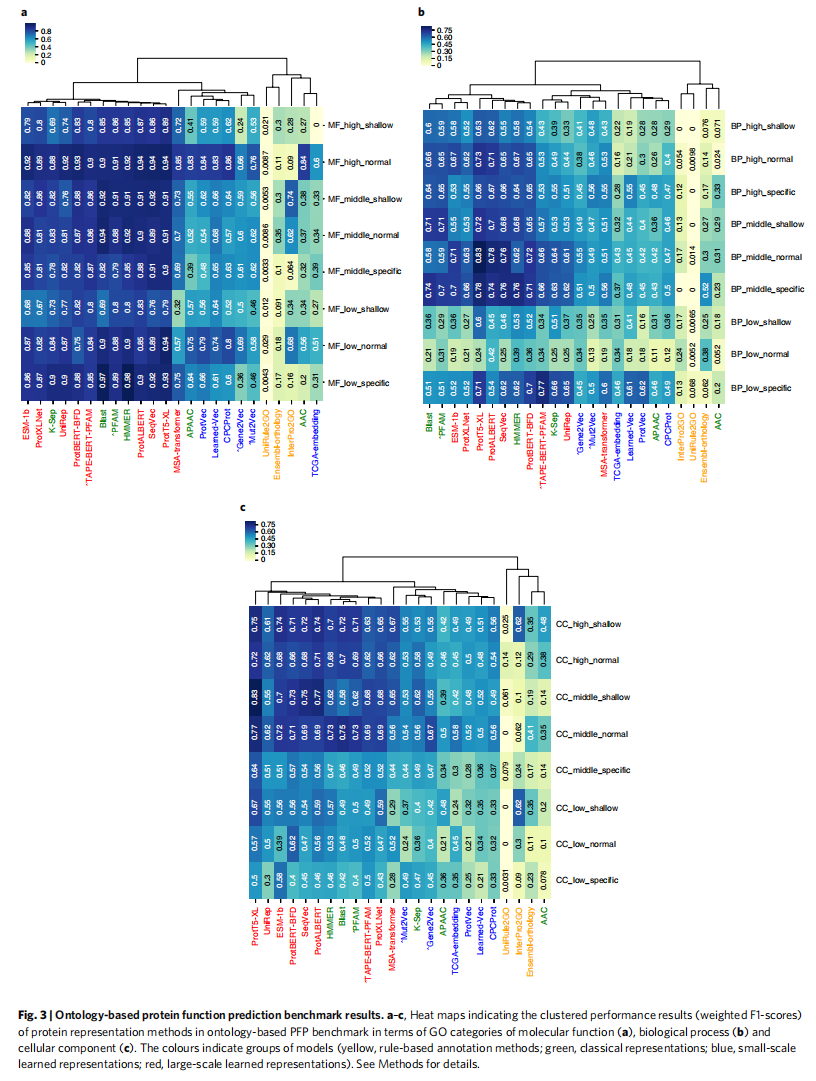
From Fig. 3, top methods are broadly similar; ProtT5-XL is best on MF, BP, and CC.
CC and BP prediction tasks perform worse overall than MF, which is reasonable because most learning-based methods use protein sequence as input, and sequence is not a direct indicator of localization (missing cleaved signal peptides) or of a protein’s role in large-scale biological processes.
Success rates for CC terms decrease as the number of annotated proteins decreases; similar trends appear for BP and MF. However, increasing or decreasing term specificity (shallow/general vs. specific/informative terms) did not show a comparable pattern, possibly indicating that predicting specific/informative GO terms remains difficult because many such terms have few annotated proteins.
Drug target protein family classification
Representation performance was measured in a drug-discovery setting by predicting major families of drug target proteins (enzymes, membrane receptors, transcription factors, ion channels, etc.).
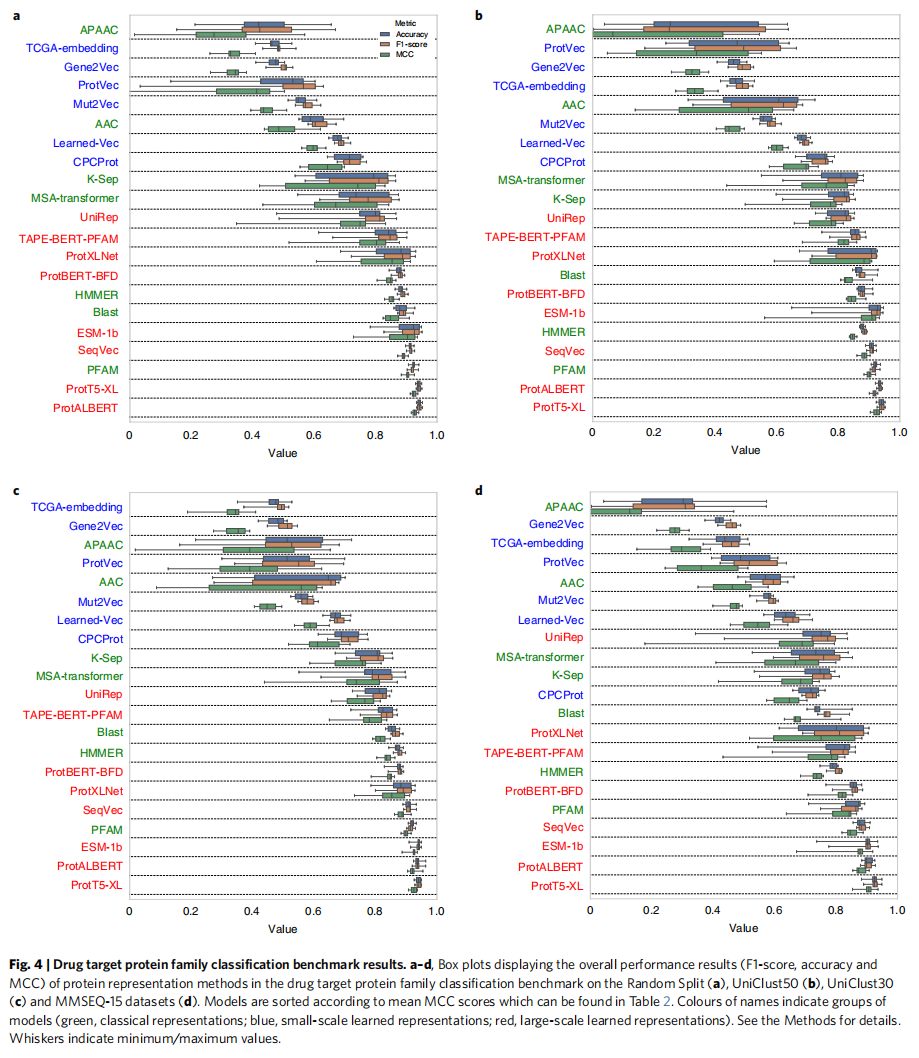
Four versions of the protein family annotation dataset were prepared, each filtered by a different predetermined sequence similarity threshold (random split, and datasets clustered at 50%, 30%, and 15% similarity using Uniclust50, Uniclust30, and MMseqs2 at 15%, respectively) for train/validation splits in ten-fold cross-validation.
Similarity thresholds help assess whether models merely learn sequence similarity or capture complex implicit patterns underlying the prediction task.
ProtT5-XL again performs best. Performance generally drops at lower similarity thresholds, but classical methods decline more sharply than representation learning methods. When the similarity threshold is reduced to 15%—below the so-called twilight zone for transferring structural and functional annotation between proteins (~25% sequence similarity)—top representation learning methods still perform well, suggesting they may capture patterns beyond simple sequence similarity.
Protein–protein binding affinity estimation
The performance of representation methods in predicting experimentally determined protein–protein binding affinities was evaluated.
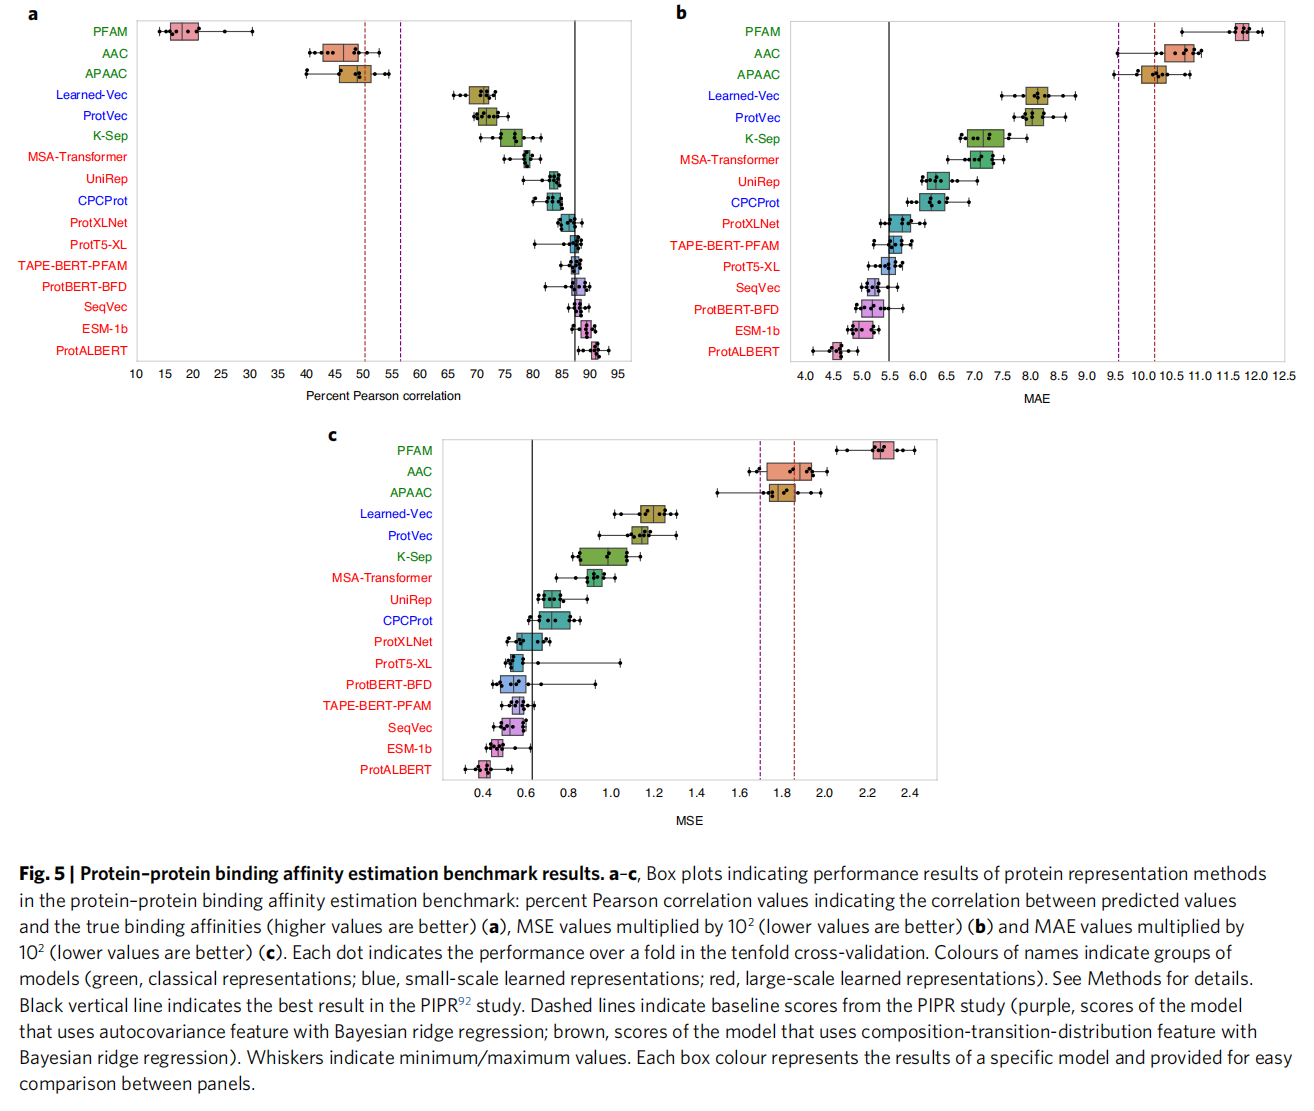
ProtALBERT performs best.
PIPR learns input sequences in a supervised, end-to-end framework to maximize binding affinity prediction. In contrast, protein representations in this benchmark are learned via tasks unrelated to binding affinity (e.g., next-amino-acid prediction during pretraining), and binding affinities are then predicted with simple supervised regression on those representations.
This can be explained by attention mechanisms: ProtTrans shows that attention heads can capture interactions between amino acids, which helps explain why ProtALBERT works best—fewer parameters than other transformer methods but the most attention heads.
Discussion
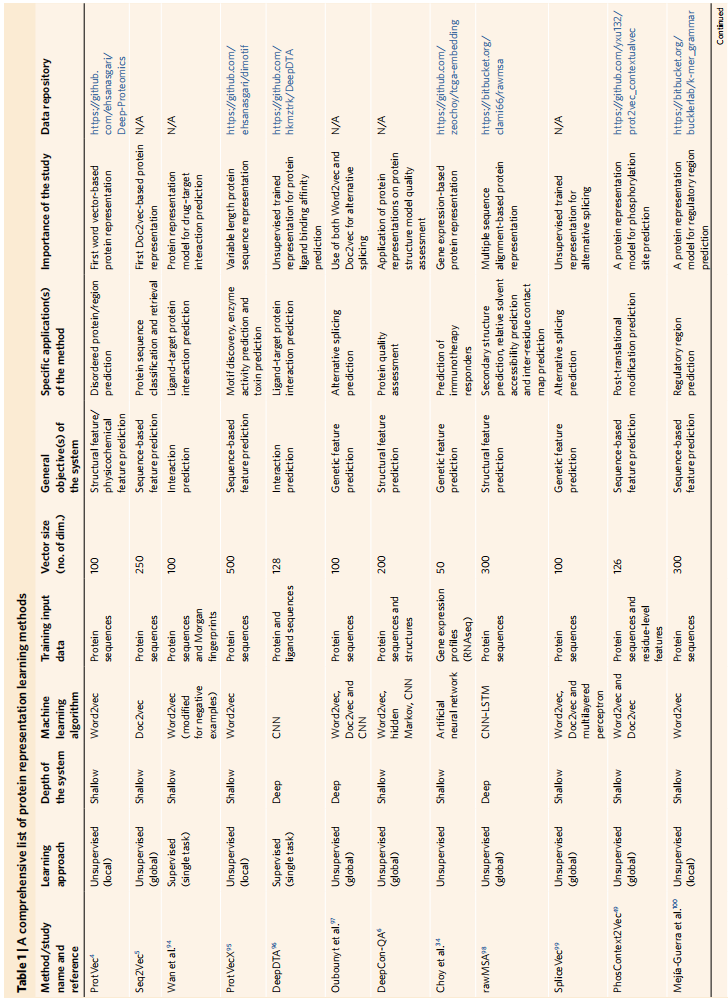
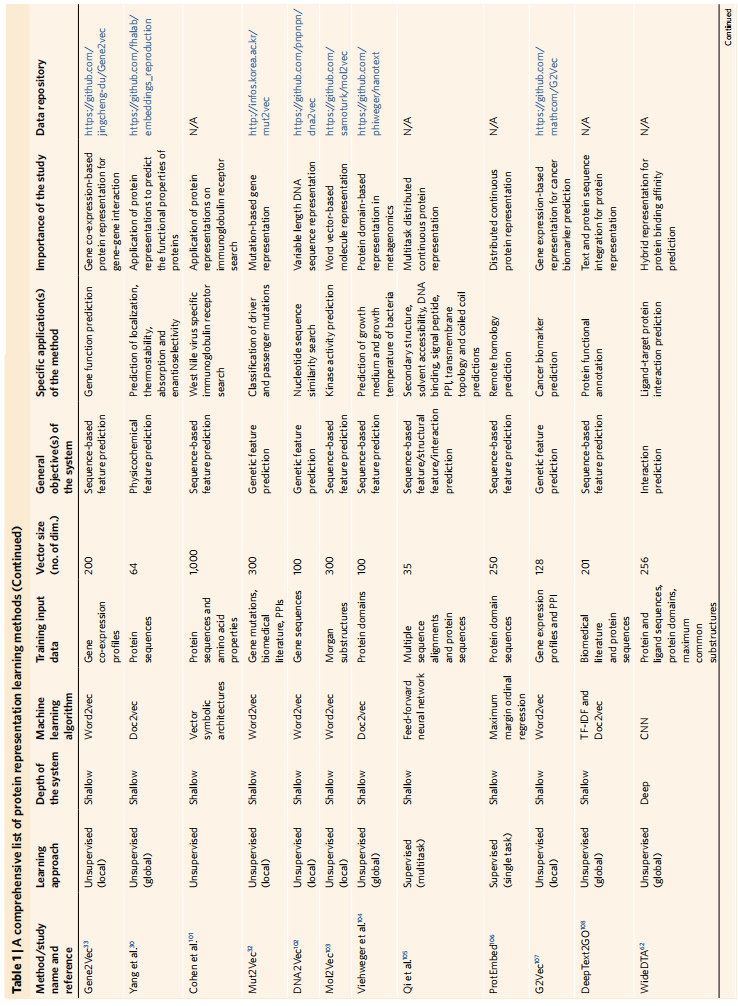
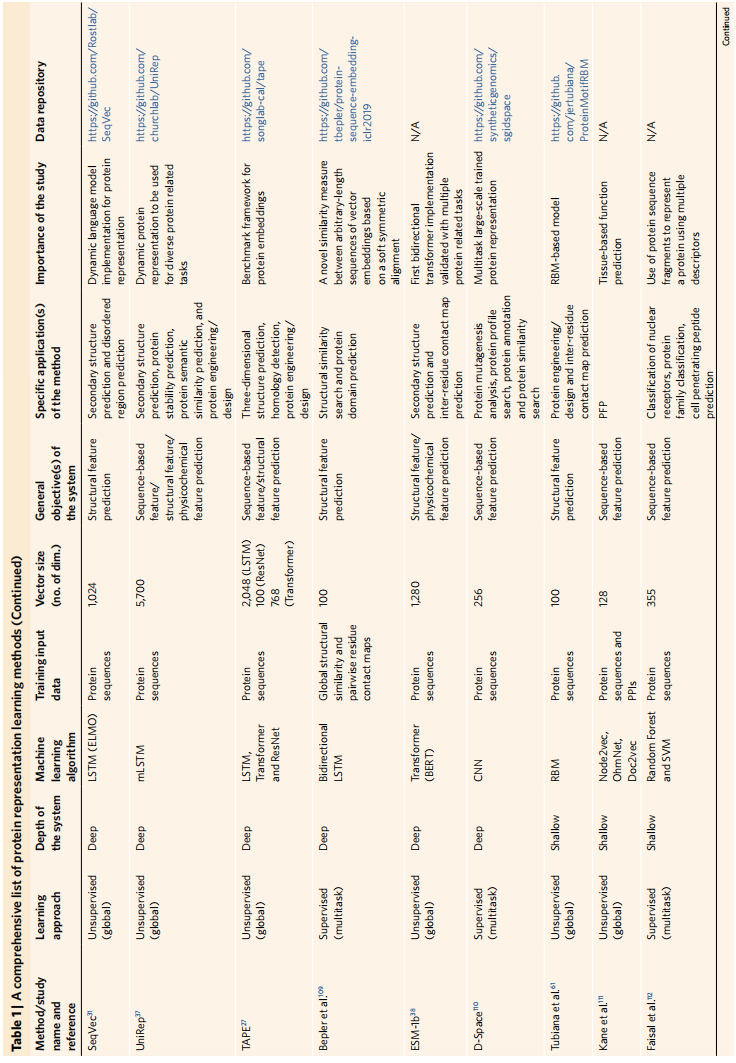
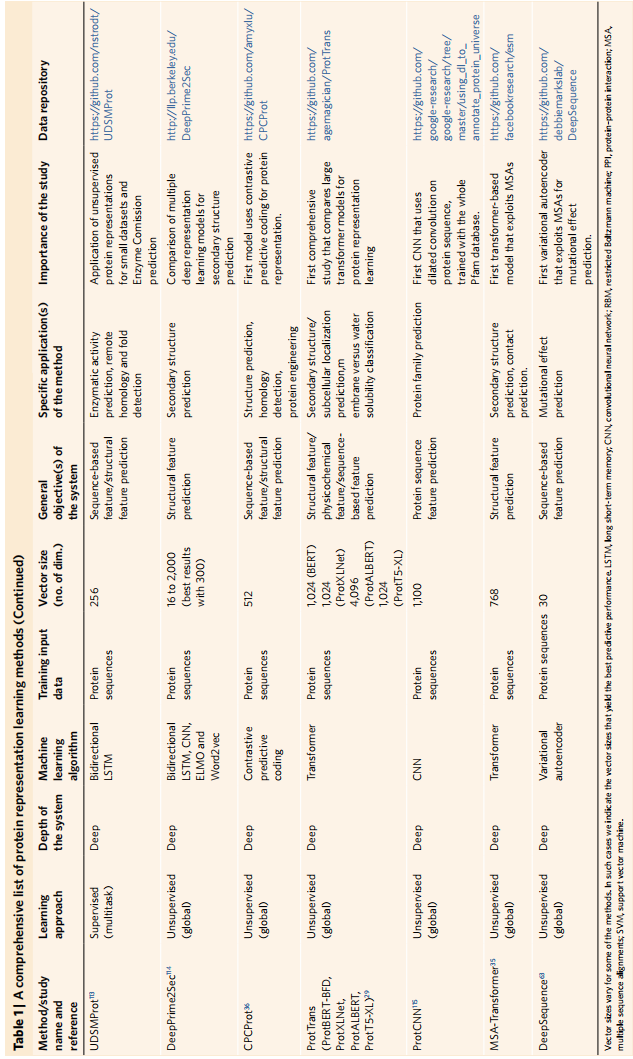
Protein representation methods are listed in Table 1; overall performance on the four prediction benchmarks is in Table 2.
Conclusions:
- Representation learning methods generally outperform classical methods in functional analysis of proteins.
- Model design and training data type/source are key factors for representation learning.
- For example, the two BERT variants in Table 2: TAPE-BERT-PFAM is trained on 32 million protein domain sequences; ProtBERT-BFD on 2.1 billion metagenomic sequence fragments; yet performance differences between them are not significant.
- More complex models such as ProtT5-XL trained on the same 2.1 billion sequences perform better, so architecture design matters most.
- Training on multiple data types can improve performance.
- Potential data leakage should be considered when building and evaluating protein representation learning methods.
- Current state and challenges of protein representation learning:
- Although inspired by NLP, proteins and natural language differ structurally.
- The protein vocabulary is small; the limited number of building blocks (20 amino acids) may favor smaller models competing with larger ones in protein representation learning, motivating protein-specific learning models.
- Model interpretability is critical for understanding performance, but most models discussed here are not interpretable. Data science often seeks to link true properties to each dimension of the output vector.
- Protein representation models often use only one data type (sequence), whereas proteins have diverse biological information such as PPIs, post-translational modifications, and gene/protein (co-)expression.
- Mut2Vec uses PPIs, mutations, and biomedical text for better accuracy;
- MSA Transformer and undirected graph models (e.g., DeepSequence) exploit homology information: DeepSequence uses posterior distributions over MSAs to compute latent factors, while MSA Transformer combines row- and column-wise attention to integrate MSA and protein language modeling, capturing evolutionary relationships.
- Two possible routes to more complete representations:
- Independently encoding different biological data types and concatenating vectors, then training to fuse them, may yield more complete representations.
- Learning with heterogeneous graphs.
- Protein representation learning can support design of new proteins.
- The explorable sequence space is huge: an average human protein has ~350 amino acids, implying 20^350 combinations, most of which are meaningless.
- Generative models can learn probability distributions from real samples and synthesize new sequences.
Methods
Five main application areas were considered: (1) protein interaction prediction (essential for molecular mechanisms and pathways), (2) physicochemical property prediction (relevant to protein engineering and drug discovery), (3) genetic feature prediction, (4) PFP, and (5) structural property prediction.
Semantic similarity inference benchmark
All human protein entries from UniProtKB/Swiss-Prot and GO term annotations from UniProt GOA (2019_11 release) were downloaded. Electronically inferred annotations with IEA evidence codes were excluded, leaving only human expert-reviewed annotations. The dataset was then enriched by propagating annotations to parent terms in the GO graph according to true-path rules.
The final fully annotated dataset contains 14,625 distinct GO terms (3,374 MF, 9,820 BP, 1,431 CC) and 326,009 annotations (75,884 MF, 154,532 BP, 95,593 CC).
Similarity was computed with Lin similarity from the GoSemSim package.

LCS is the first common ancestor of two GO terms when tracing toward the root of the GO directed acyclic graph.

3,077 proteins were used for MF-based pairwise semantic similarity, 6,154 for BP, and 4,531 for CC; many have low annotation quality, so sub-datasets were created (Well_Annotated_500, Well_Annotated_200, and Sparse Uniform).
- The first subset contains only the top 500 proteins ranked by GO annotation count (labeled Well_Annotated_500 in the figures).
- The second contains only the top 200 such proteins (Well_Annotated_200).
- In all three datasets, similarity distributions were non-uniform, producing very dense regions of similarity scores (Supplementary Fig. 2); rank changes among nearly similar pairs reduced correlation values, accumulating mass around low correlations and reducing discriminative power. To mitigate this, every thousandth protein pair was sampled from the ranked pairwise similarity list in the Well_Annotated_500 set to obtain a uniformly distributed dataset. This final set has 247 similarity scores among 40 distinct proteins (Sparse Uniform). Among the three datasets, Sparse Uniform is easiest to predict; Well_Annotated_500 is most challenging.
Thus there are two pairwise similarity arrays: one from GO-derived semantic similarity between proteins in the dataset (ground truth), and one from pairwise similarities computed directly from representation vectors.
Ontology-based PFP benchmark
For each GO category (MF, BP, CC), data were processed as follows:
- Human proteins and GO term annotations were obtained from UniProtKB/Swiss-Prot and UniProt GOA (both 2019_10 release).
- All electronic annotations (evidence code IEA) were removed from GO annotation lists to improve reliability and prevent error propagation during prediction.
- For each GO term, a separate list was created for cross-validation training and testing. Each protein list was filtered with UniRef clusters (sequence-similarity-based protein clusters). UniRef50 was used so that no two sequences in a list exceed 50% sequence similarity.
- GO terms were grouped into low, middle, or high by annotated protein count: 2–30 low, 100–500 middle, ≥1000 high.
- GO term specificity was grouped into shallow, normal, and specific: terms in the top third of maximum depth per branch are shallow, the middle third normal, the deepest third specific.
- The two three-way groupings yield nine combinations; with three GO categories that would be 27 groups, but two are empty (MF-high-specific and CC-high-specific), so 25 groups were analyzed.
Drug target protein family classification benchmark
ChEMBL (v.25) was used—a curated collection of drug/compound–target interaction (bioactivity) data for experimental and computational drug discovery and development. Four broad target families were used, with remaining targets grouped as a fifth class (enzymes, membrane receptors, transcription factors, ion channels, and other).
Training and test sets at different similarity levels were built as four datasets. UniClust, a sequence-similarity clustering scheme, provided precomputed clusters at different granularities (e.g., 50%, 30%); an additional 15% granularity cluster set was created for human proteins.
Protein–protein binding affinity estimation benchmark
The Structural Kinetics and Energetics of Mutant Protein Interactions (SKEMPI) dataset was used.
In the benchmark phase, 2,950 data points from SKEMPI were used as the train/test set to measure how well protein representation methods directly predict binding affinity values (including measurements for wild-type and mutually independent mutant proteins).
<HR align=left color=#987cb9 SIZE=1>