Frontiers in Microbiology-2022 iThermo:A Sequence-Based Model for Identifying Thermophilic Proteins Using a Multi-Feature Fusion Strategy
Implementation: http://lin-group.cn/server/iThermo/index.html
iThermo: Hand-crafted features, feature selection, and MLP prediction
Abstract
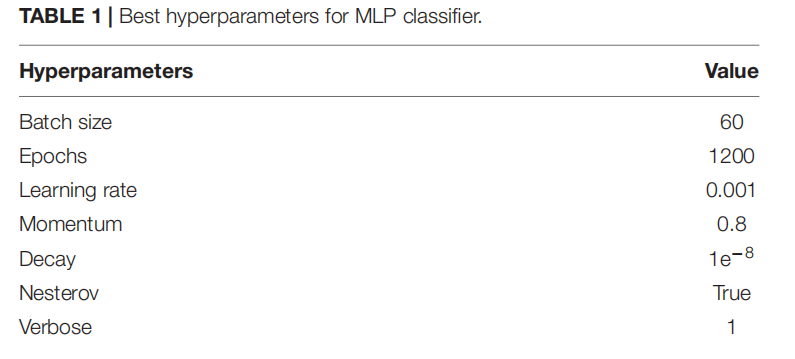
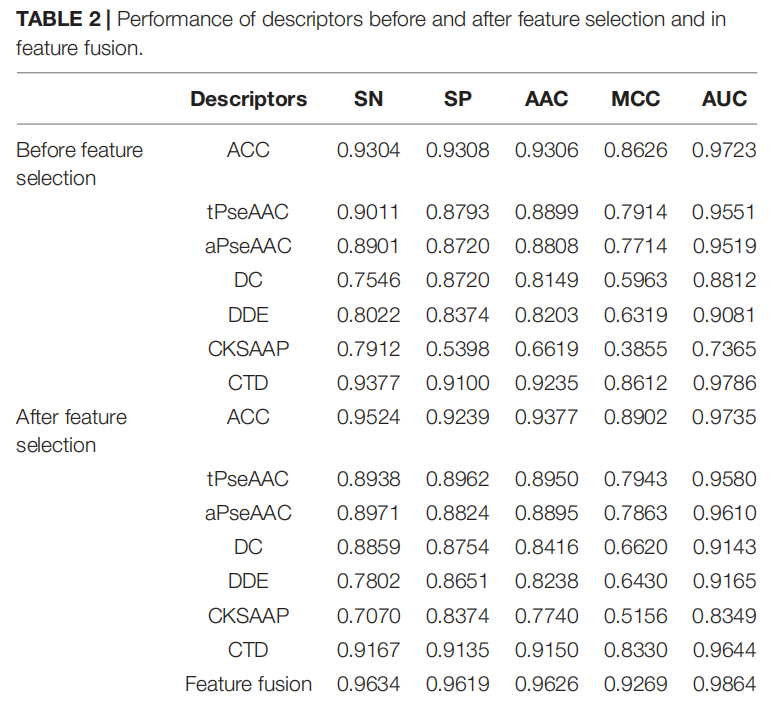
Thermophilic proteins are important in biotechnology and industrial processes, so a fast and accurate method is needed to identify them. The authors built a benchmark dataset of 1,368 thermophilic and 1,445 non-thermophilic proteins and used an MLP with a multi-feature fusion strategy to distinguish thermophilic from non-thermophilic proteins, reaching 96.26% accuracy.
Introduction
In general, organisms that survive at an optimal growth temperature (OGT) below 50°C are considered mesophiles, whereas those that survive at an OGT of 50°C or above are called thermophiles; their proteins are thermostable and can effectively withstand temperatures up to 120°C.
Many studies have addressed thermophilic proteins. Protein thermal stability has been linked to amino acid distribution, dipeptide composition (DC), hydrophobicity, hydrogen bonds, residues and inter-residue contacts, helical polar surface, side-chain interactions, and salt bridges.
Materials and Methods
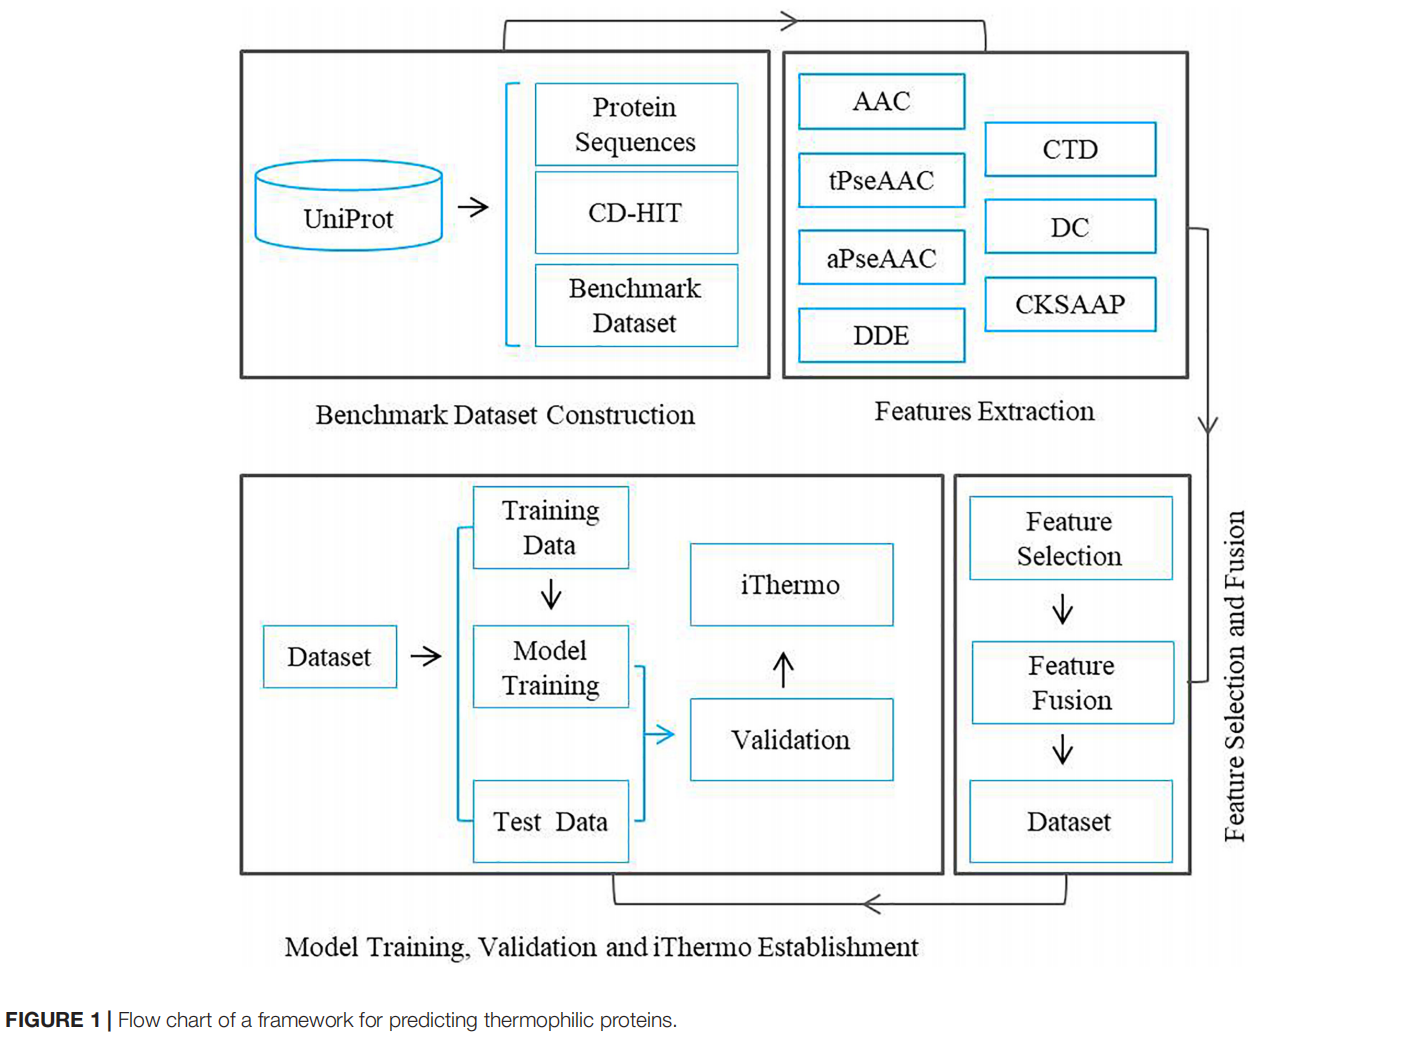
Dataset
In earlier work, researchers used 50°C as a cutoff to build a benchmark dataset. That threshold is not fully objective, because proteins can remain stable above the OGT of the source organism; negative samples below 50°C may still function above 60°C, which causes ambiguity. For example, proteins from a microbe living at 45°C may not denature at 60°C.
To reduce this confusion, the authors classified proteins as thermophilic if they are stable above 60°C and non-thermophilic if below 30°C.
All proteins were retrieved from UniPort. The following steps were applied to ensure data quality:
- Retain manually curated proteins
- Exclude sequences with ambiguous residues
- Exclude fragments of other proteins
- Exclude proteins inferred only from prediction or homology
- To reduce redundancy and homology bias, CD-HIT was used with a 30% sequence identity cutoff
The final benchmark contained 1,443 non-thermophilic and 1,366 thermophilic proteins, with an 80:20 train–test split.
Feature Extraction
Seven protein feature types were generated with the iFethare program.
Amino Acid Composition
Frequency of each of the 20 amino acids in the sequence.

Traditional Pseudo Amino Acid Composition
Residue correlation is described from physicochemical properties; each protein P can be represented in a (20 + λ)-dimensional space:

Each dimension is computed as follows, where $f_u$ is the amino acid frequency and $\tau_k$ is the k-tier sequence-correlation factor:

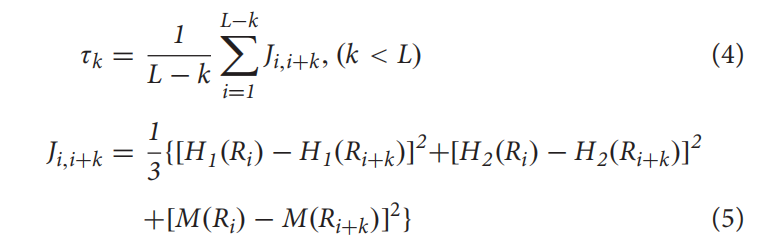
Here $H_1(R_i)$ is hydrophobicity, $H_2(R_i)$ is hydrophilicity, and $M(R_i)$ is the side-chain mass of amino acid Ri.
Amphiphilic Pseudo Amino Acid Composition
This descriptor captures partial sequence-order effects of amino acids based on hydrophobicity and hydrophilicity.

Composition of k-Spaced Amino Acid Pairs
CKSAAP describes the frequency of amino acid pairs separated by k residues, with k from 0 to 5.

F0 denotes CKSAAP at k = 0; F is the frequency of zero-spaced amino acid pairs, and n0 is the total count of zero-spaced pairs.
Dipeptide Composition
Dipeptide composition is the frequency of each dipeptide in the protein sequence.

Dipeptide Deviation From Expected Means
This measure combines dipeptide composition (DC), theoretical mean (Tm), and theoretical variance (Tv).


Cg is the total number of codons encoding amino acid g, and Ch is the total for amino acid h. CN is the number of codons excluding stop codons.

N is the sequence length.
Composition, Transition, and Distribution
By amino acid property, the 20 types are grouped into polar, neutral, and hydrophobic. Under the CTD definition, Composition (C) is the percentage of polar, neutral, and hydrophobic residues; Transition (T) is the frequency of transitions between groups; Distribution (D) is the position of the first 25%, 50%, 75%, and 100% of residues in each group.

Feature Selection
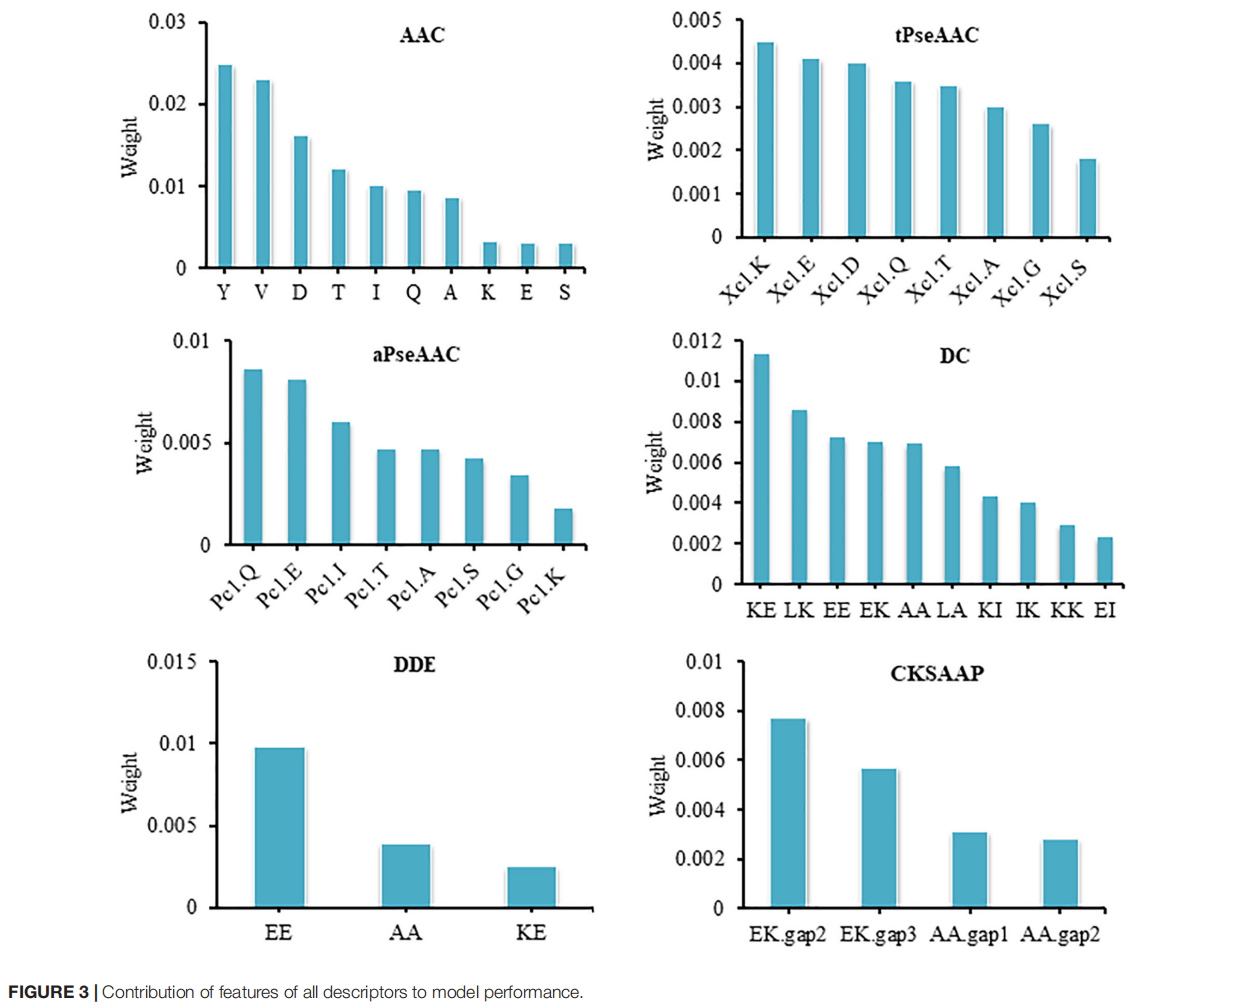
Analysis of variance (ANOVA) selects an optimal feature subset via F-values. The F-value is the ratio of between-class variance to within-class variance for a feature; larger F-values indicate greater contribution to separating positive and negative samples.

$s^2_b$ is the between-class variance and $s^2_w$ is the within-class variance for each feature.
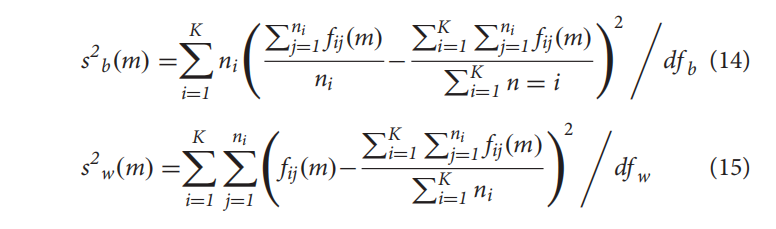
K is the total number of features and N is the total number of samples.
Classification
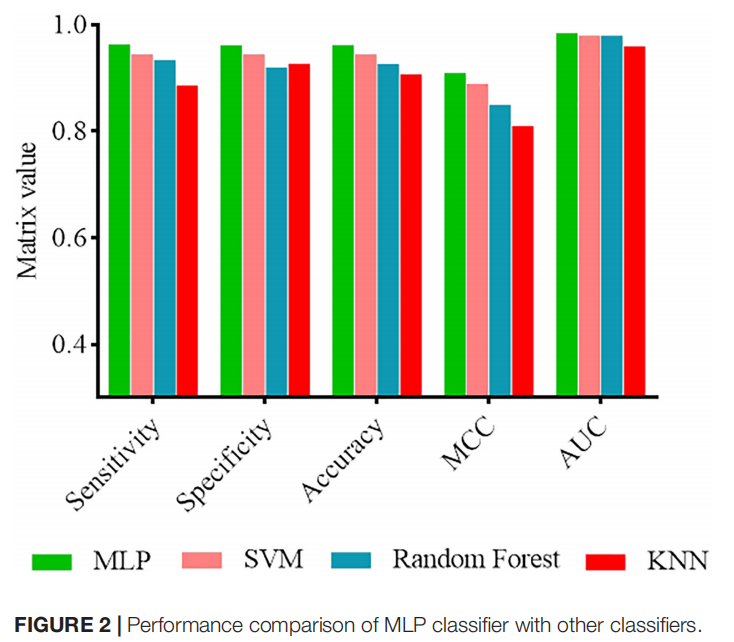
SVM, random forest, k-nearest neighbors, and multilayer perceptron.
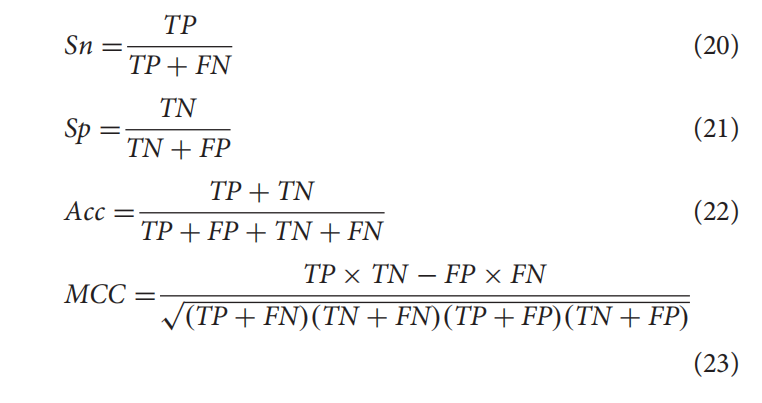
Performance Evaluation
Results and Discussion