
NeurIPS-2023 ProteinGym:Large-Scale Benchmarks for Protein Design and Fitness Prediction
Paper: ProteinGym: Large-Scale Benchmarks for Protein Design and Fitness Prediction
Code: https://github.com/OATML-Markslab/ProteinGym/tree/main
ProteinGym v1: A protein fitness benchmark
Abstract
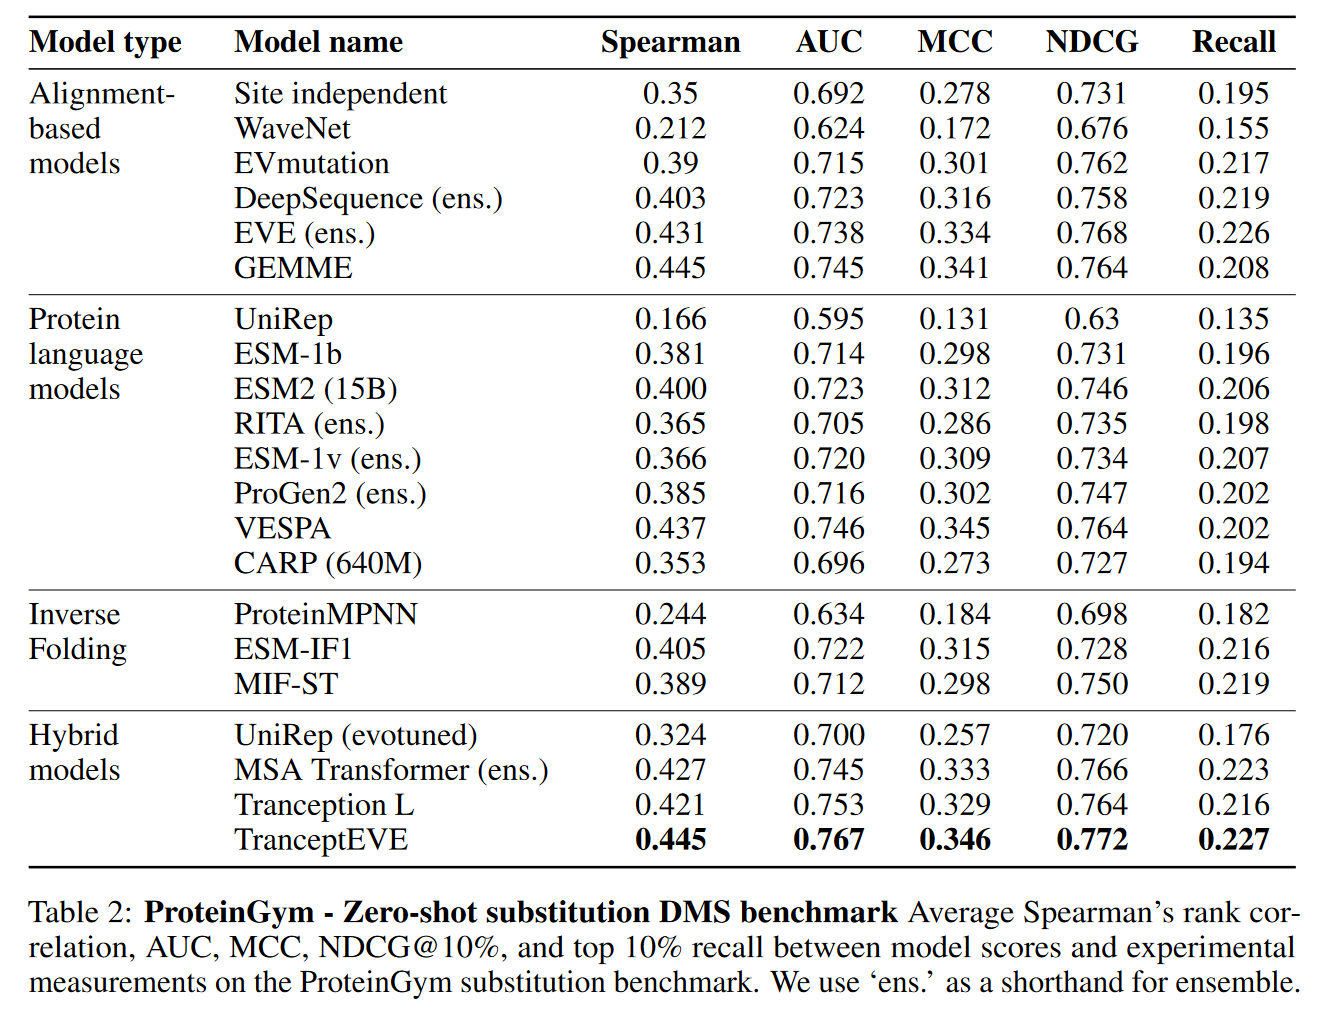
This work introduces the ProteinGym v1.0 fitness benchmark and a complete evaluation framework, and benchmarks more than 40 models.
Introduction
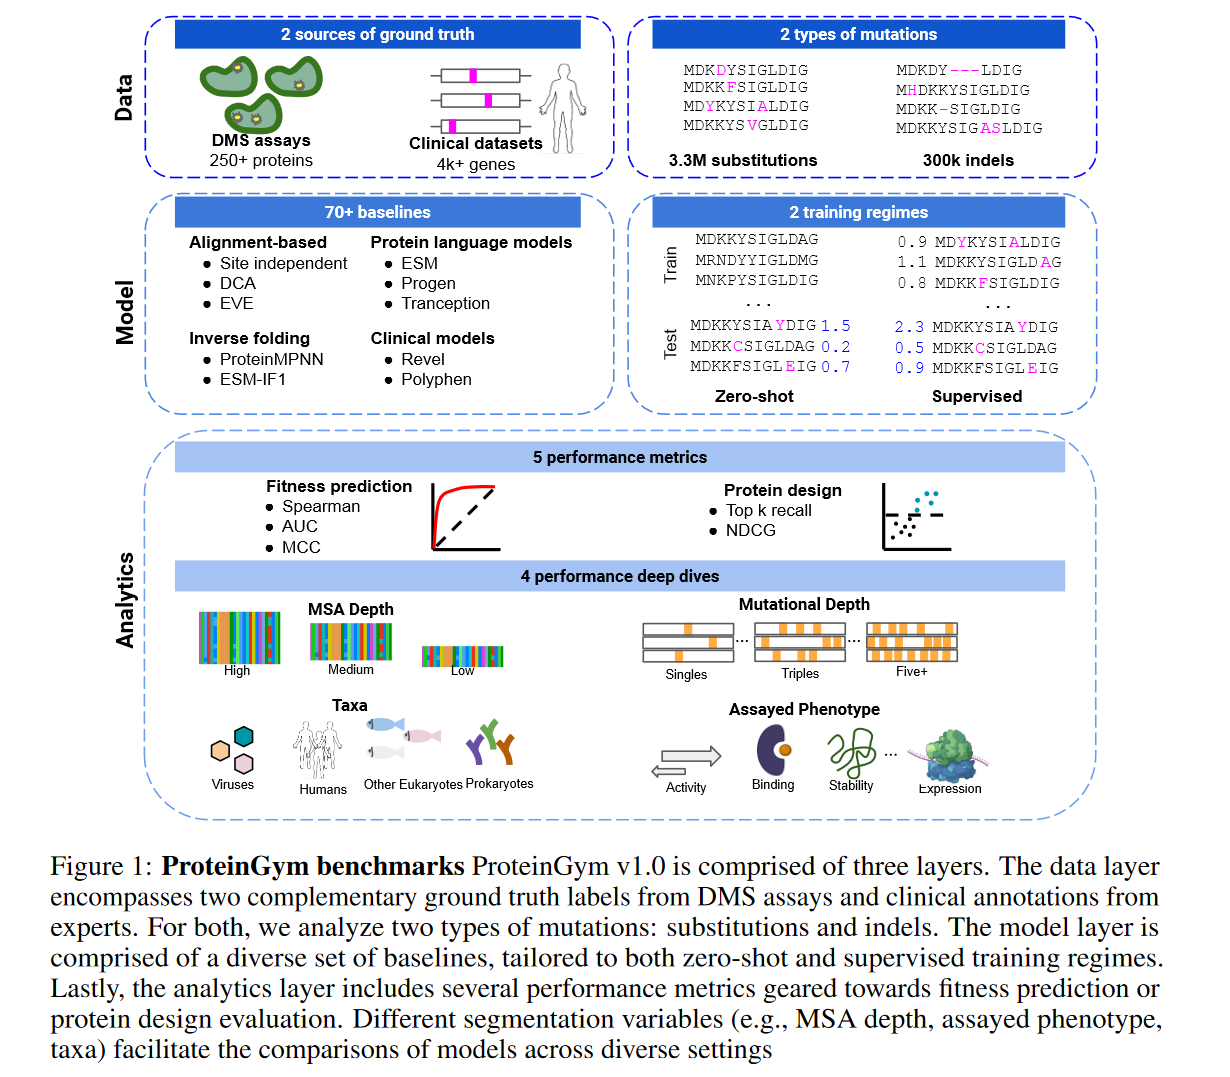
Learning to predict protein sequence or structure and map them to downstream phenotypes is often framed as modeling the fitness landscape; more accurate benchmarks better assess whether machine learning methods are effective. The authors aggregate over 250 deep mutational scanning (DMS) assays totaling 3.5M mutant sequences, spanning more than 200 protein families.
ProteinGym benchmarks
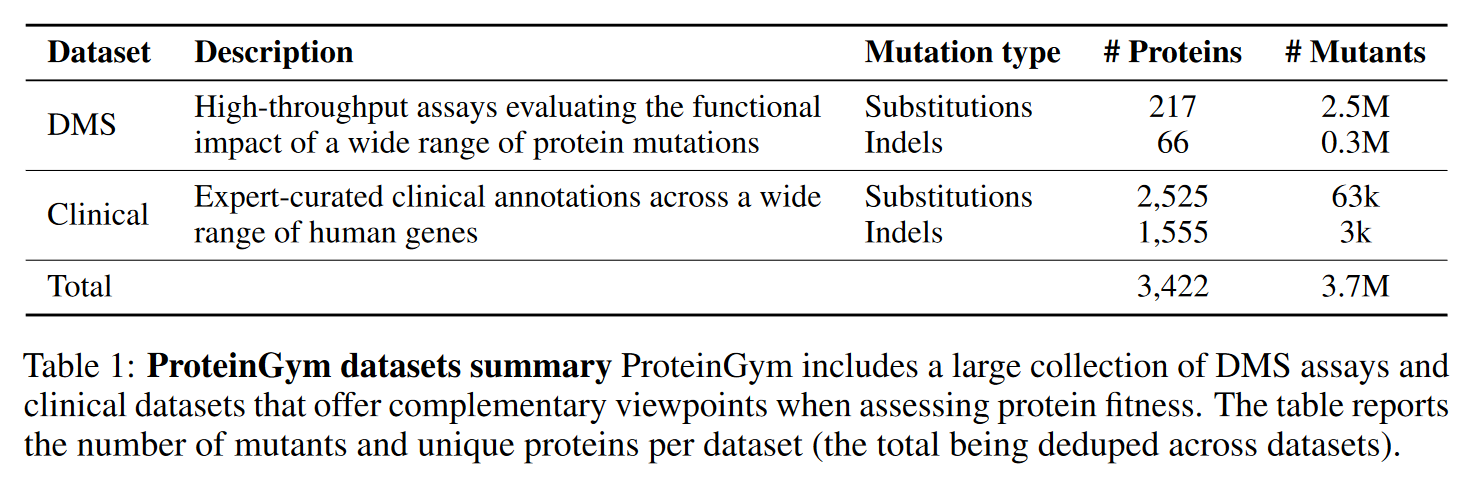
Evaluation framework
Zero-shot benchmark
DMS assays
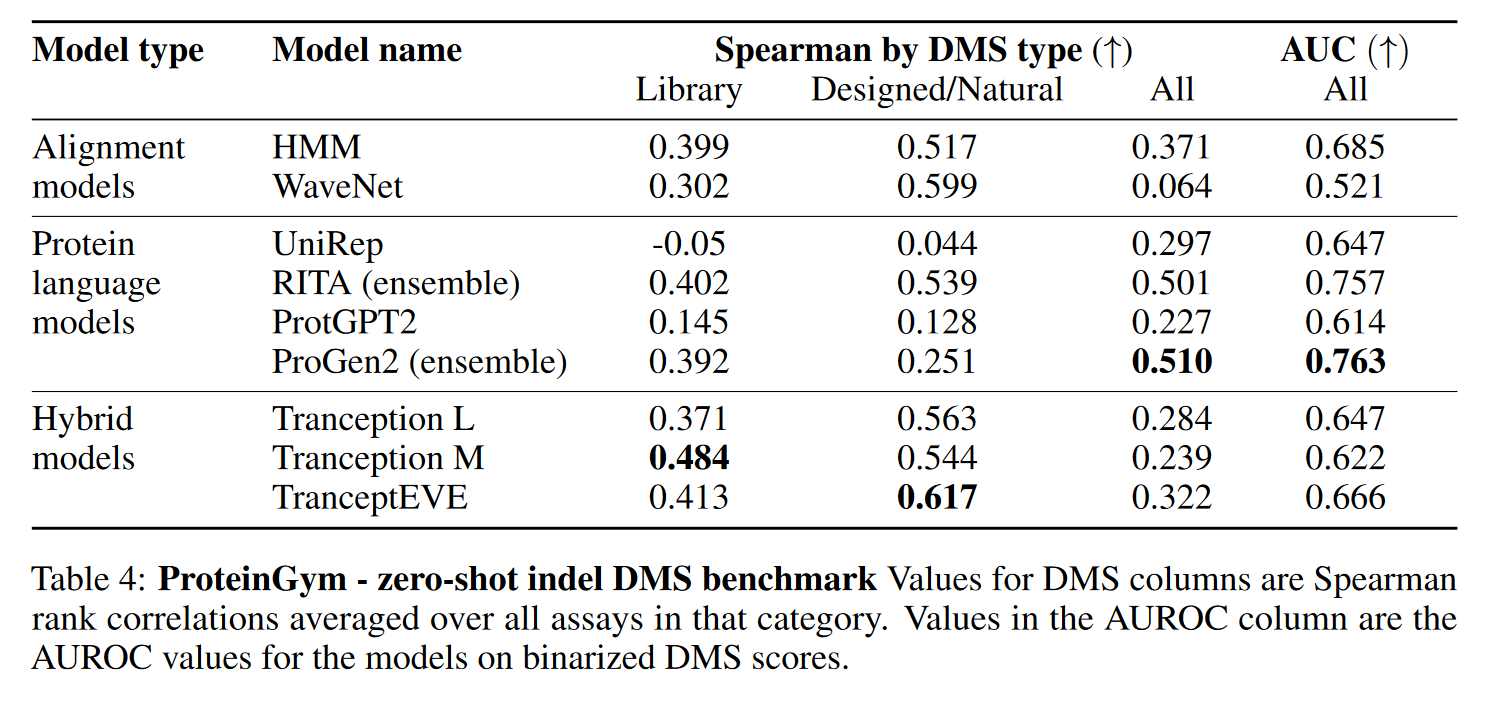
Because protein function and fitness are nonlinear, Spearman’s rank correlation coefficient is a useful metric.
Some DMS assays exhibit bimodal fitness distributions, so correlation alone may be insufficient; the authors also report Area Under the ROC Curve (AUC) and Matthews Correlation Coefficient (MCC) on binarized experimental measurements.
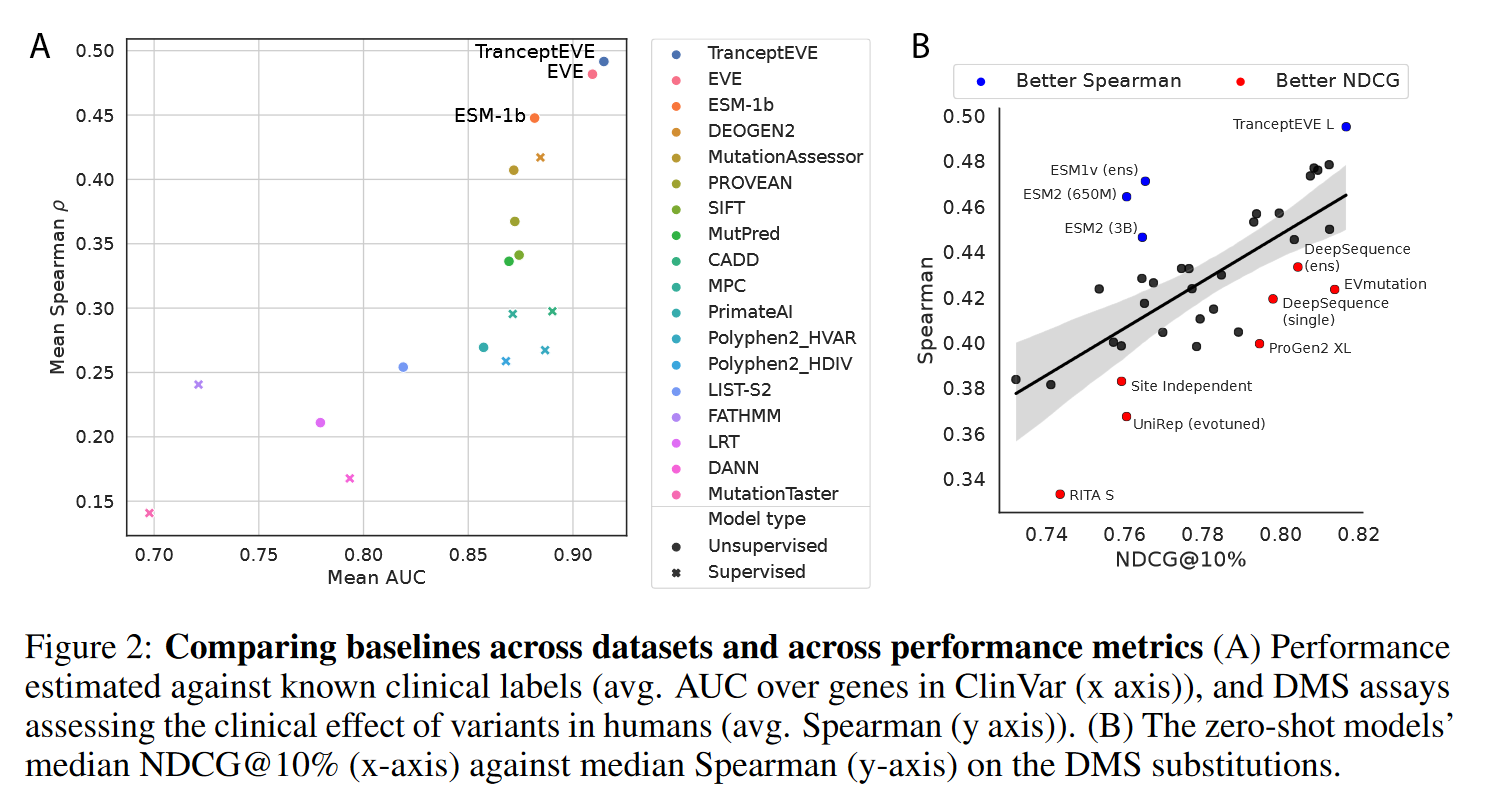
Because models should rank higher-fitness variants rather than match the data distribution, they additionally use Normalized Discounted Cumulative Gain (NDCG).
They also compute Top-K recall, with K set to the top 10% of variants in each DMS assay.
Clinical datasets
They report AUC and precision–recall curves.
Supervised benchmark
DMS assays
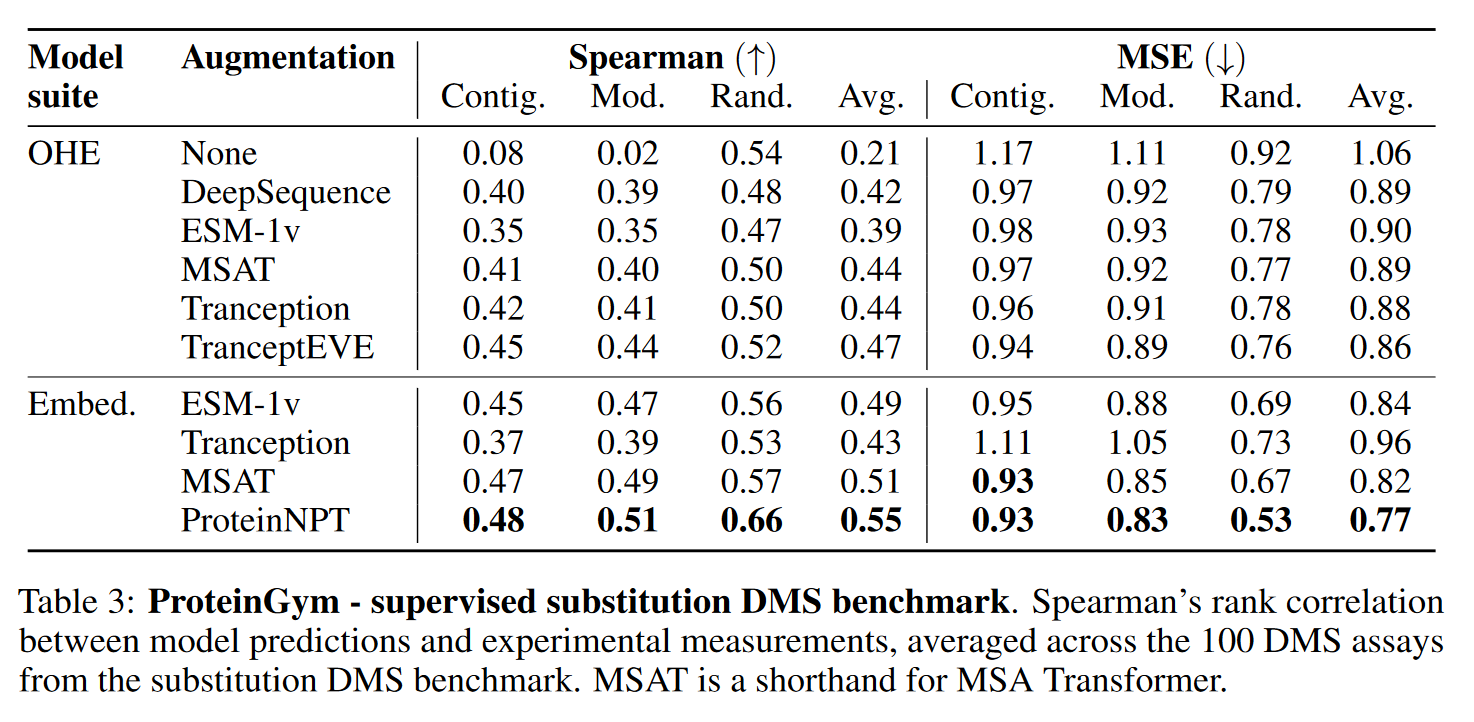
Three cross-validation schemes are used:
- Random scheme: each mutation is assigned randomly to one of five folds.
- Contiguous scheme: the sequence is split into five contiguous blocks.
- Modulo scheme: positions are assigned to folds by position index modulo the number of folds, yielding five folds in total.
Evaluation uses Spearman’s correlation and Mean Squared Error (MSE).
Results
Substitution benchmarks
<HR align=left color=#987cb9 SIZE=1>